2 min read
Introducing geom_terrorbar()
Motivation I was reading Adam Mastroianni’s excellent blog post on peer review (it’s really good, go check it out) because it’s Christmas time and I don’t have to be a code …

34 min read
Making an interactive data visualisation, Part 2
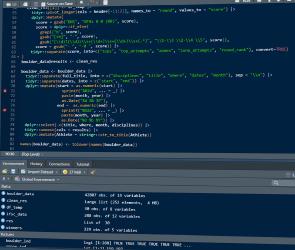
Data wrangling
We left off in the previous part in a place where we ended up with quite a lot of IFSC bouldering world cup data scraped from Wikipedia and saved in a CSV file. Today, we will talk about data cleaning …

18 min read
Making an interactive data visualisation, Part 1
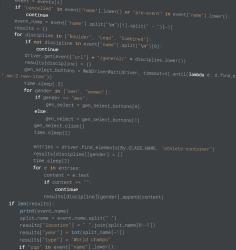
Getting data
I’ll start this post with a little bit of background on why I made the visualisation in the first place. Now, I am really into climbing. Though I’m not particularly good at it, I do it …